Alibaba Taobao User Behaviors Analysis V: User Journey purchase behavior Clustering
Author: Zizhun Guo
作者:
写于:
Alibaba Taobao User Behaviors Analysis V: User Journey purchase behavior Clustering - KMeans with MLlib
Recap of the user behavior table
+-------+-------+-----------+--------+----------+-------------------+----------+-----+---+----+---------+
|user_id|item_id|category_id|behavior|timestamps|           datetime|      date|month|day|hour|dayofweek|
+-------+-------+-----------+--------+----------+-------------------+----------+-----+---+----+---------+
|      1|2268318|    2520377|      pv|1511544070|2017-11-24 12:21:10|2017-11-24|   11| 24|  12|        6|
|      1|2333346|    2520771|      pv|1511561733|2017-11-24 17:15:33|2017-11-24|   11| 24|  17|        6|
|      1|2576651|     149192|      pv|1511572885|2017-11-24 20:21:25|2017-11-24|   11| 24|  20|        6|
|      1|3830808|    4181361|      pv|1511593493|2017-11-25 02:04:53|2017-11-25|   11| 25|   2|        7|
|      1|4365585|    2520377|      pv|1511596146|2017-11-25 02:49:06|2017-11-25|   11| 25|   2|        7|
|      1|4606018|    2735466|      pv|1511616481|2017-11-25 08:28:01|2017-11-25|   11| 25|   8|        7|
|      1| 230380|     411153|      pv|1511644942|2017-11-25 16:22:22|2017-11-25|   11| 25|  16|        7|
|      1|3827899|    2920476|      pv|1511713473|2017-11-26 11:24:33|2017-11-26|   11| 26|  11|        1|
|      1|3745169|    2891509|      pv|1511725471|2017-11-26 14:44:31|2017-11-26|   11| 26|  14|        1|
|      1|1531036|    2920476|      pv|1511733732|2017-11-26 17:02:12|2017-11-26|   11| 26|  17|        1|
+-------+-------+-----------+--------+----------+-------------------+----------+-----+---+----+---------+
only showing top 10 rows
| Behavior | Explanation |
|---|---|
| pv | Page view of an item’s detail page, equivalent to an item click |
| fav | Purchase an item |
| cart | Add an item to shopping cart |
| buy | Favor an item |
User Journey
A user journey is the experiences a person has when interacting with something, typically software. User journeys describe at a high level of detail exactly what steps different users take to complete a specific task within a system, application, or website. User journeys are focused on the user and what they see and what they do, in comparison to the related web design term click path which is just a plain list of the text URLs that are hit when a user follows a particular Journey.
The customer journey is divided into five phases which refer to the AIDA model.
- Awareness Awareness for the product is awakened (inspiration)
- Interest The interest in the product is increased (favoritism)
- Desire The customer is considering buying the product (wish)
- Action The product is bought (implementation)
We have found the concept of user journey can be applied to the taobao Dataset. (see Part II conversion analysis) In taobao dataset, it has four behavior types which are page view, favorite, cart and buy. Combining with user_id and item_id, a user journey behavior can be defined as a series of behaviors conducted by a user targeting a specific item. See example below: Table 1: a user journey track
| user_id | item_id | Timestamps | Behavior |
|---|---|---|---|
| 100 | 12345678 | 2017-11-25 13:04:00 | pv |
| 100 | 12345678 | 2017-11-25 13:12:23 | fav |
| 100 | 12345678 | 2017-11-27 10:56:10 | pv |
| 100 | 12345678 | 2017-11-27 20:23:59 | buy |
See table 1 above, a user (id: 100) has viewed a page of the item (id: 12345678) at 2017-11-25 13:04:00. 8 mins later, this user had put this item into the favorite list. Two days later, this user viewed this item again. About 10 hours later, at 8 pm on the same day, this user purchased this item.
Goal
The goal of the task is to use millions of user-journey behaviors to identify customer categories/clusters that can be useful for targeted consumer insights at scale. The tool to implement is Apache Spark: Spark SQL and MLlib. The clustering model is KMeans.
Preprocessing
From part I, most of the behaviors are in dates between 2017-11-24 to 2017-12-03, therefore we select 5,000,000 records of behaviors from the subset of the dataset. Another reason to choose only 5M records instead of the 100M from the original size is that while doing statistic analysis later after KMeans, the virtual machine’s memory (8GM) simply cannot hold the query processing when conducted on the aggregated temporary view, hence only taking part of the dataset.
Feature Engineering: Aggregation
Set up some statistical rules to extract some features from the orignal dataset:
| Rule | Explanation |
|---|---|
| duration | The time difference between the minimal timestamps and maximum timestamps within the user journey |
| behavior_count | The total behavior count of a user journey |
| pv | The pv count of a user journey |
| fav | The fav count of a user journey |
| cart | The cart count of a user journey |
| buy | The buy count of a user journey |
| label | Whether the user have purchased the item or not |
df = spark.sql("""
SELECT
    user_id,
    item_id,
    MAX(timestamps)-MIN(timestamps) as duration,
    COUNT(item_id) as behavior_count,
    SUM(CASE WHEN behavior = 'pv' THEN 1 ELSE 0 END) as pv,
    SUM(CASE WHEN behavior = 'fav' THEN 1 ELSE 0 END) as fav,
    SUM(CASE WHEN behavior = 'cart' THEN 1 ELSE 0 END) as cart,
    SUM(CASE WHEN behavior = 'buy' THEN 1 ELSE 0 END) as buy
FROM taobao
GROUP BY user_id, item_id
ORDER BY user_id, item_id ASC
""")

df.createOrReplaceTempView("taobao_clustering")

df = spark.sql("""
SELECT
    *,
    CASE WHEN buy > 0 THEN 1 ELSE 0 END as label
FROM taobao_clustering
""")

from pyspark.ml.feature import VectorAssembler

assembler = VectorAssembler(inputCols = feat_cols, outputCol = 'features')
final_data = assembler.transform(df)

from pyspark.ml.feature import StandardScaler

scaler = StandardScaler(inputCol = 'features', outputCol = 'scaledFeatures')
scaler_model = scaler.fit(final_data)
cluster_final_data = scaler_model.transform(final_data)
Quick view for the Spark dataframe:
+-------+-------+--------+--------------+---+---+----+---+-----+--------------------+--------------------+
|user_id|item_id|duration|behavior_count| pv|fav|cart|buy|label|            features|      scaledFeatures|
+-------+-------+--------+--------------+---+---+----+---+-----+--------------------+--------------------+
|      1|1305059|     0.0|             1|  1|  0|   0|  0|    0| (7,[1,2],[1.0,1.0])|(7,[1,2],[0.99231...|
|      1|1323189|     0.0|             1|  1|  0|   0|  0|    0| (7,[1,2],[1.0,1.0])|(7,[1,2],[0.99231...|
|      1|1338525|     0.0|             1|  1|  0|   0|  0|    0| (7,[1,2],[1.0,1.0])|(7,[1,2],[0.99231...|
|      1|1340922|     0.0|             1|  1|  0|   0|  0|    0| (7,[1,2],[1.0,1.0])|(7,[1,2],[0.99231...|
|      1|1531036|     0.0|             1|  1|  0|   0|  0|    0| (7,[1,2],[1.0,1.0])|(7,[1,2],[0.99231...|
|      1|2028434|     0.0|             1|  1|  0|   0|  0|    0| (7,[1,2],[1.0,1.0])|(7,[1,2],[0.99231...|
|      1|2041056|     0.0|             1|  1|  0|   0|  0|    0| (7,[1,2],[1.0,1.0])|(7,[1,2],[0.99231...|
|      1|2087357| 29426.0|             2|  2|  0|   0|  0|    0|(7,[0,1,2],[29426...|(7,[0,1,2],[0.347...|
|      1|2104483|     0.0|             1|  1|  0|   0|  0|    0| (7,[1,2],[1.0,1.0])|(7,[1,2],[0.99231...|
|      1|2266567|     0.0|             1|  1|  0|   0|  0|    0| (7,[1,2],[1.0,1.0])|(7,[1,2],[0.99231...|
+-------+-------+--------+--------------+---+---+----+---+-----+--------------------+--------------------+
only showing top 10 rows
Clustering KMeans
Apply KMeans to the scaled dataset with different k values.
KMeans hyperparameters:
| hyperparameter | Value |
|---|---|
| tol | 0.0001 |
| maxIter | 20 |
| distanceMeasure | euclidean |
| weightCol | none |
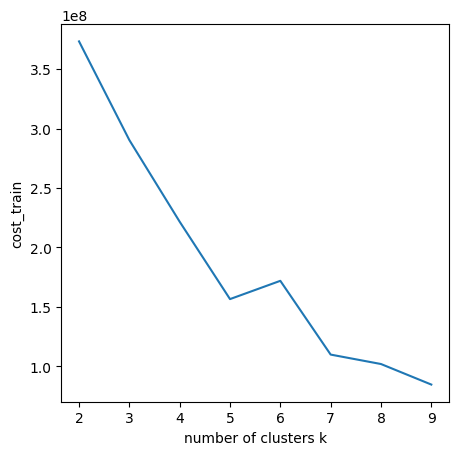
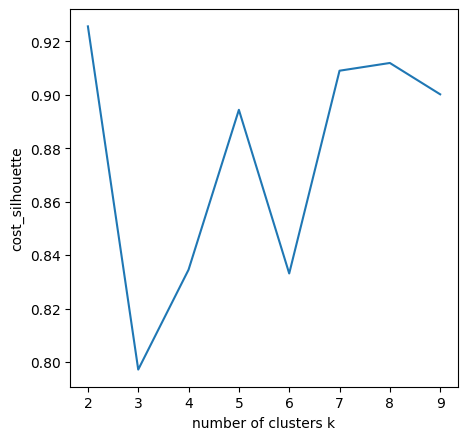
Using Elbow/Knee Method for a quick look-out to select K values.
Looks like k = 3, k = 5 and k = 6 are the good change-points. Select k = 5 as the cluster numbers. Here print out the clustering results. (The ‘prediction’ indicates the cluster number ranged from 0 - 4)
+-------+-------+--------+--------------+---+---+----+---+-----+--------------------+--------------------+----------+
|user_id|item_id|duration|behavior_count| pv|fav|cart|buy|label|            features|      scaledFeatures|prediction|
+-------+-------+--------+--------------+---+---+----+---+-----+--------------------+--------------------+----------+
|      1|1305059|     0.0|             1|  1|  0|   0|  0|    0| (7,[1,2],[1.0,1.0])|(7,[1,2],[0.93053...|         0|
|      1|1323189|     0.0|             1|  1|  0|   0|  0|    0| (7,[1,2],[1.0,1.0])|(7,[1,2],[0.93053...|         0|
|      1|1338525|     0.0|             1|  1|  0|   0|  0|    0| (7,[1,2],[1.0,1.0])|(7,[1,2],[0.93053...|         0|
|      1|1340922|     0.0|             1|  1|  0|   0|  0|    0| (7,[1,2],[1.0,1.0])|(7,[1,2],[0.93053...|         0|
|      1|1531036|     0.0|             1|  1|  0|   0|  0|    0| (7,[1,2],[1.0,1.0])|(7,[1,2],[0.93053...|         0|
|      1|2028434|     0.0|             1|  1|  0|   0|  0|    0| (7,[1,2],[1.0,1.0])|(7,[1,2],[0.93053...|         0|
|      1|2041056|     0.0|             1|  1|  0|   0|  0|    0| (7,[1,2],[1.0,1.0])|(7,[1,2],[0.93053...|         0|
|      1|2087357| 29426.0|             2|  2|  0|   0|  0|    0|(7,[0,1,2],[29426...|(7,[0,1,2],[0.344...|         0|
|      1|2104483|     0.0|             1|  1|  0|   0|  0|    0| (7,[1,2],[1.0,1.0])|(7,[1,2],[0.93053...|         0|
|      1|2266567|     0.0|             1|  1|  0|   0|  0|    0| (7,[1,2],[1.0,1.0])|(7,[1,2],[0.93053...|         0|
|      1|2268318|     0.0|             1|  1|  0|   0|  0|    0| (7,[1,2],[1.0,1.0])|(7,[1,2],[0.93053...|         0|
|      1|2278603|     0.0|             1|  1|  0|   0|  0|    0| (7,[1,2],[1.0,1.0])|(7,[1,2],[0.93053...|         0|
|      1|2286574|     0.0|             1|  1|  0|   0|  0|    0| (7,[1,2],[1.0,1.0])|(7,[1,2],[0.93053...|         0|
|      1| 230380|     0.0|             1|  1|  0|   0|  0|    0| (7,[1,2],[1.0,1.0])|(7,[1,2],[0.93053...|         0|
|      1|2333346|     0.0|             1|  1|  0|   0|  0|    0| (7,[1,2],[1.0,1.0])|(7,[1,2],[0.93053...|         0|
|      1|2576651|     0.0|             1|  1|  0|   0|  0|    0| (7,[1,2],[1.0,1.0])|(7,[1,2],[0.93053...|         0|
|      1| 266784| 25123.0|             2|  2|  0|   0|  0|    0|(7,[0,1,2],[25123...|(7,[0,1,2],[0.294...|         0|
|      1| 271696|     0.0|             1|  1|  0|   0|  0|    0| (7,[1,2],[1.0,1.0])|(7,[1,2],[0.93053...|         0|
|      1|2734026|     0.0|             1|  1|  0|   0|  0|    0| (7,[1,2],[1.0,1.0])|(7,[1,2],[0.93053...|         0|
|      1|2791761|     0.0|             1|  1|  0|   0|  0|    0| (7,[1,2],[1.0,1.0])|(7,[1,2],[0.93053...|         0|
+-------+-------+--------+--------------+---+---+----+---+-----+--------------------+--------------------+----------+
only showing top 20 rows
Analysis
Statistic Analysis
+-------+-----------------+------------------+------------------+-------------------+-------------------+--------------------+--------------------+------------------+
|summary|         duration|    behavior_count|                pv|                fav|               cart|                 buy|               label|        prediction|
+-------+-----------------+------------------+------------------+-------------------+-------------------+--------------------+--------------------+------------------+
|  count|           756408|            756408|            756408|             756408|             756408|              756408|              756408|            756408|
|   mean|21433.50689707142|1.3220378420111898| 1.184676788188385| 0.0371333989064103|0.07331228649088851|0.026915368425505813|0.025566889826654397|0.4321940011210881|
| stddev|85385.05928533341|1.0746465690895712|0.9953649718484974|0.19056521625685005| 0.2690200842701817| 0.17201339406933566| 0.15783933890990312|1.1010077907100033|
|    min|              0.0|                 1|                 0|                  0|                  0|                   0|                   0|                 0|
|    max|         787426.0|               153|               153|                  7|                  6|                  11|                   1|                 4|
+-------+-----------------+------------------+------------------+-------------------+-------------------+--------------------+--------------------+------------------+
The duration are in seconds unit hence dividing 3600 to convert into hours. The longest duration of the user journey lasts about 9 days. The average duration of the user journey takes around 6 hours.
From label(whether purchased or not) features, it finds 2.5 out of 100 items are eventually purchased. From pv(page view count for each user behavior), we found each item is at least being view once(1.18). Similar findings are documented in the previous part[part II].
Intra-clusters Analysis
Group by the cluster index and calculat the mean values for all features.
df_k5_statistics = spark.sql("""
SELECT prediction AS cluster,
        COUNT(DISTINCT user_id) AS user,
        COUNT(item_id) AS behavior,
        ROUND(AVG(duration)/3600,2) AS avg_duratiion,
        ROUND(AVG(behavior_count),2) as avg_num_behaviors,
        ROUND(AVG(pv),2) as avg_pv,
        ROUND(AVG(fav),2) as avg_fav,
        ROUND(AVG(cart),2) as avg_cart,
        ROUND(AVG(buy),2) as avg_buy,
        ROUND(AVG(label),2) as avg_label
FROM purchase_clustered
GROUP BY prediction
ORDER BY prediction asc
""")
df_k5_statistics.show()
Results:
+-------+----+--------+------------+-----------------+------+-------+--------+-------+---------+
|cluster|user|behavior|avg_duration|avg_num_behaviors|avg_pv|avg_fav|avg_cart|avg_buy|avg_label|
+-------+----+--------+------------+-----------------+------+-------+--------+-------+---------+
|      0|9701|  639437|        0.91|             1.12|  1.12|    0.0|     0.0|    0.0|      0.0|
|      1|6673|   19246|       29.08|             3.08|  1.76|   0.07|     0.2|   1.05|      1.0|
|      2|6688|   28996|       93.98|             3.97|   3.7|   0.05|    0.22|    0.0|      0.0|
|      3|3700|   25239|       10.52|             1.62|  0.58|   1.01|    0.03|    0.0|      0.0|
|      4|6853|   43490|        8.49|             1.61|  0.59|    0.0|    1.02|    0.0|      0.0|
+-------+----+--------+------------+-----------------+------+-------+--------+-------+---------+
Heatmap
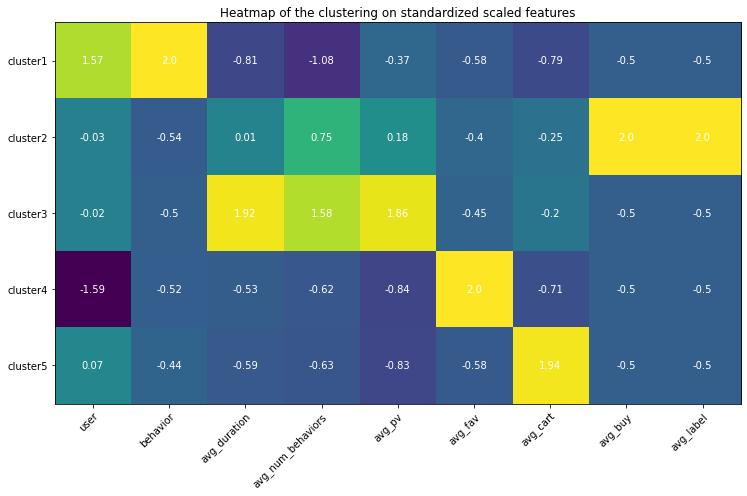
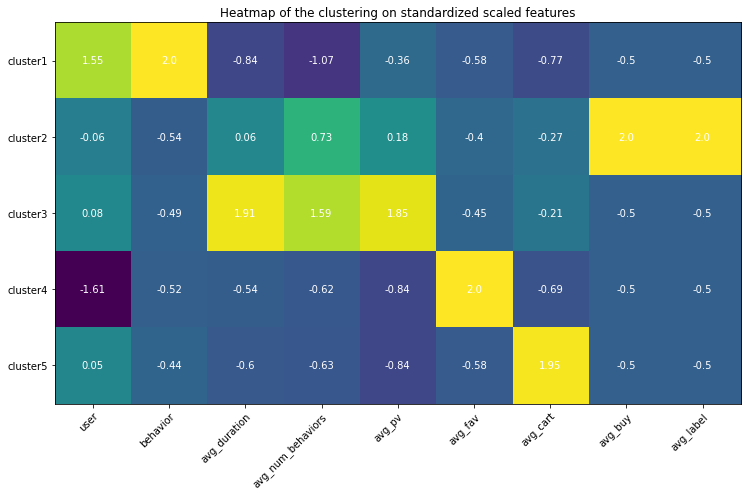
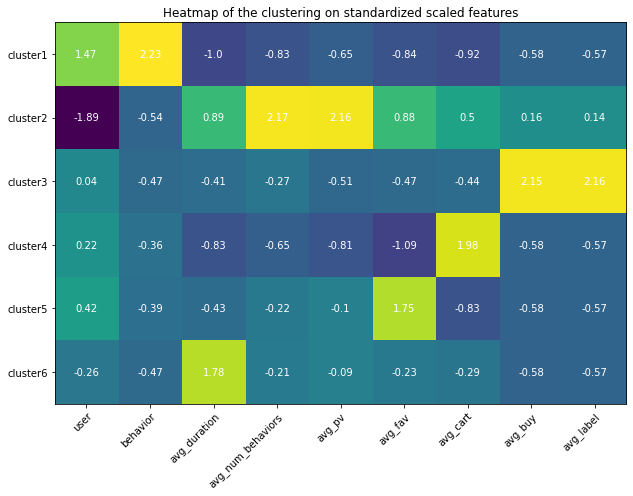
Use heatmap to differentiate among clusters. The highlighted square indicates the feature values are higher than the one from other clusters, which help understand the special traits for that cluster using the domain knowledge.
Use sklearn Standardize features to remove the mean and scale to unit variance.
from sklearn.preprocessing import StandardScaler
scaler = StandardScaler()
scaler.fit(df_k5)
heatmap(np.around(scaler.transform(df_k5), 2))
Analysis based on the heatmap and values
- Cluster 1: this group of behaviors are in high numbers and have the largest number of users involved. However, none of them converts to the final purchase order and they are even unlikely to trigger adding the items to the cart. Among all behavior types, it seems page views are in averages but still, they seem hibernates and less active. The duration between the user journey is the longest.
- Cluster 2: these are the true buyers’ behaviors - averaged user journey duration, above averaged page view count, few carting behaviors, all these behaviors leading to the successfully created purchasing order.
- Cluster 3: these are the active app users’ behavior patterns, almost no purchase at all, but conducting the greatest amount of behaviors in which the most of them are page views. The conversion rate is very low. Maybe the item is too expensive or because of other reasons that users are hesitating. The average user journey duration lasts around 4 days.
- Cluster 4: these behaviors are browsing-focused since there is much less page view amount than the favorite amount, therefore these behaviors are conducted by the browsing pages where the user does not need to click the items’ landing pages but just add the item in the list to the favorites.
- Cluster 5: just like Cluster 4 happened in the users’ browsing process, users directly put items into the cart, and thereafter no further actions were conducted.
| Cluster | User Journey Behavior Type |
|---|---|
| 1 | Hibernate |
| 2 | Active purchasing |
| 3 | Active Viewing |
| 4 | Collectors |
| 5 | Hesitator |
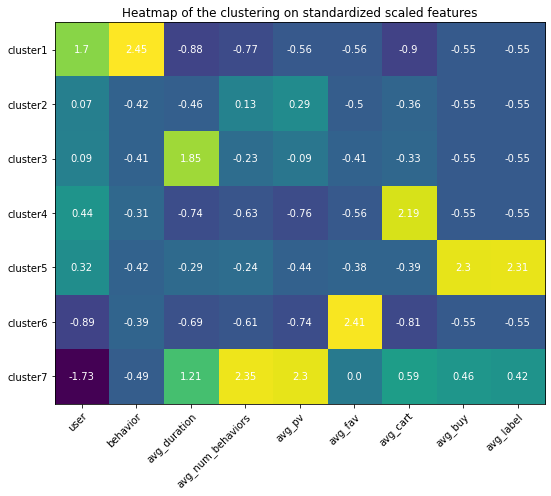
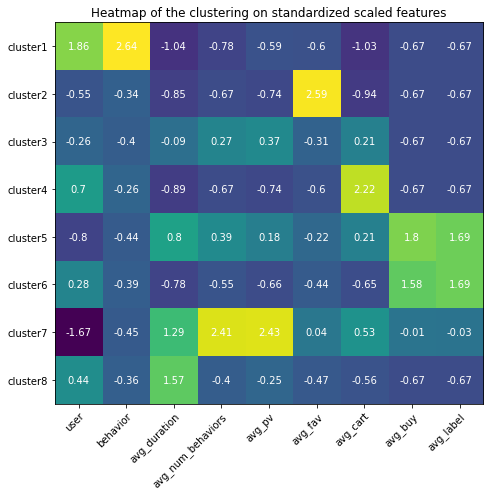
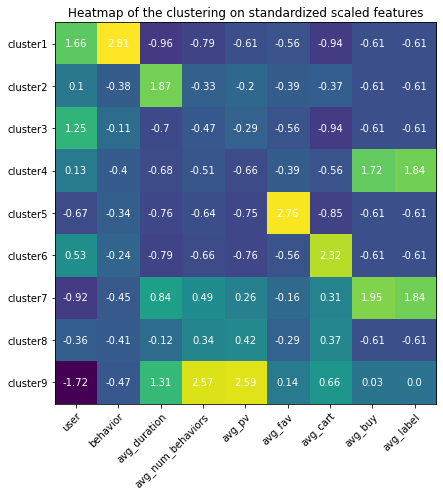
Appendix (Updated 9/19/2021)
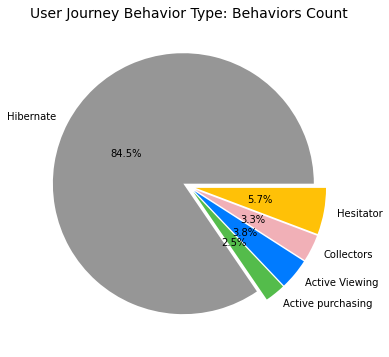
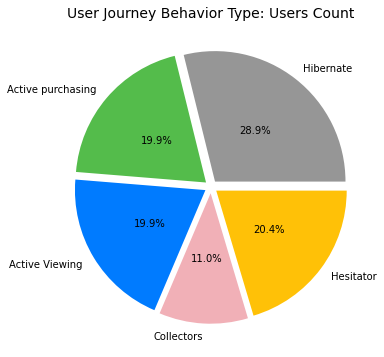
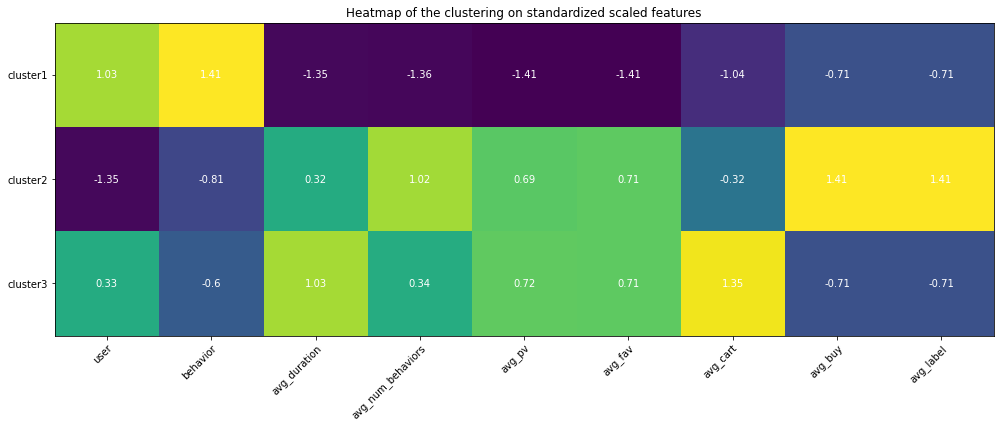
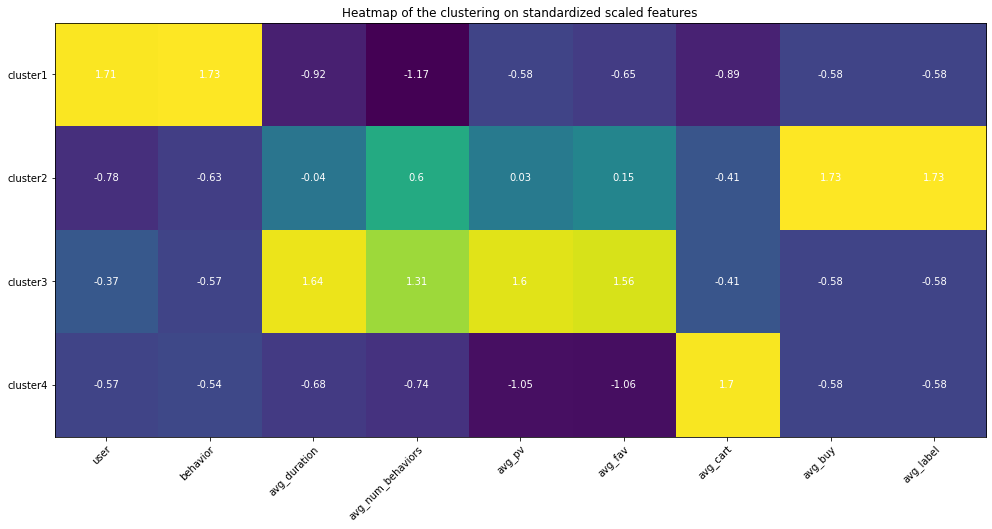
Since I had set up my personal cloud workspace, I had successfully fit the entire 100 billion records into the models using PySpark. Here are the updated results:
Copyright @ 2021 Zizhun Guo. All Rights Reserved.

