Alibaba Taobao User Behaviors Analysis III: AARRR Framework (Activation/Retention) - DAU, Retention Rate, etc
Author: Zizhun Guo
作者:
写于:
1. Recap of the user behavior table
+-------+-------+-----------+--------+----------+-------------------+----------+-----+---+----+---------+
|user_id|item_id|category_id|behavior|timestamps|           datetime|      date|month|day|hour|dayofweek|
+-------+-------+-----------+--------+----------+-------------------+----------+-----+---+----+---------+
|      1|2268318|    2520377|      pv|1511544070|2017-11-24 12:21:10|2017-11-24|   11| 24|  12|        6|
|      1|2333346|    2520771|      pv|1511561733|2017-11-24 17:15:33|2017-11-24|   11| 24|  17|        6|
|      1|2576651|     149192|      pv|1511572885|2017-11-24 20:21:25|2017-11-24|   11| 24|  20|        6|
|      1|3830808|    4181361|      pv|1511593493|2017-11-25 02:04:53|2017-11-25|   11| 25|   2|        7|
|      1|4365585|    2520377|      pv|1511596146|2017-11-25 02:49:06|2017-11-25|   11| 25|   2|        7|
|      1|4606018|    2735466|      pv|1511616481|2017-11-25 08:28:01|2017-11-25|   11| 25|   8|        7|
|      1| 230380|     411153|      pv|1511644942|2017-11-25 16:22:22|2017-11-25|   11| 25|  16|        7|
|      1|3827899|    2920476|      pv|1511713473|2017-11-26 11:24:33|2017-11-26|   11| 26|  11|        1|
|      1|3745169|    2891509|      pv|1511725471|2017-11-26 14:44:31|2017-11-26|   11| 26|  14|        1|
|      1|1531036|    2920476|      pv|1511733732|2017-11-26 17:02:12|2017-11-26|   11| 26|  17|        1|
+-------+-------+-----------+--------+----------+-------------------+----------+-----+---+----+---------+
only showing top 10 rows
| Behavior | Explanation |
|---|---|
| pv | Page view of an item’s detail page, equivalent to an item click |
| fav | Purchase an item |
| cart | Add an item to shopping cart |
| buy | Favor an item |
2. Activation
The Activation evaluates the Ecommerce’s ability to provide users with the “Aha moment”. It overlaps the concept with the acquisition a little, but the difference is that the activation focuses on the micro-conversion part whereas users are having enjoyable and solid experiences in the individual part of the product process.
Daily Active behaviors distribution
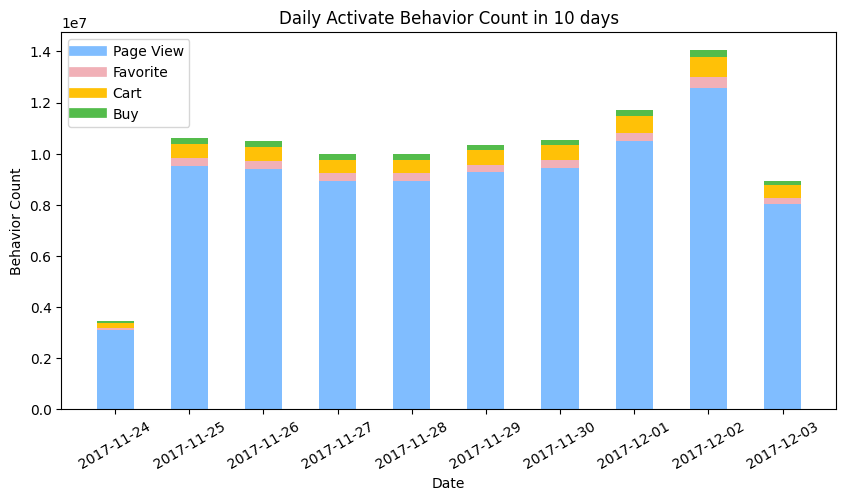
Details aside, first look at the distribution for the number of daily behaviors between 2017-11-24 to 2017-12-03.
df_date_behavior_count = spark.sql("""
SELECT
    date,
    SUM(CASE WHEN behavior = 'pv' THEN 1 ELSE 0 END) AS pv,
    SUM(CASE WHEN behavior = 'fav' THEN 1 ELSE 0 END) AS fav,
    SUM(CASE WHEN behavior = 'cart' THEN 1 ELSE 0 END) AS cart,
    SUM(CASE WHEN behavior = 'buy' THEN 1 ELSE 0 END) AS buy
FROM
    taobao
GROUP BY
    date
ORDER BY date
""").toPandas()

print(df_date_behavior_count)
- The number of page view behaviors overwhelmed the other three behaviors favorite, cart, and buy.
- The day of the week for 2017-11-24 is Friday in Beijing Time (GMT+8), whereas it has 13 hours jet leg from US Eastern Time (GMT-5) in winter. It is weird to find that the behavior count on 11-24 is much smaller than 12-01. An assumption to this phenomenon is when binning the behaviors, the part of behaviors conducted in 2017-11-25 morning in china was grouped into the 2017-11-24 in American Time zone, hence the current bars should be moved 1 day after and the value for each date should be partially tunned one by one.
- The current histogram cannot quantitively confirm the relation of behavior count between days, but the trend can be guessed out. After modification, the number of behaviors on Saturday and Sunday is higher than on weekdays.
Daily Active Users(DAU) distribution
df_DAU = spark.sql("""
SELECT
    date,
    COUNT(DISTINCT user_id) AS DAU
FROM
    taobao
GROUP BY
    date
ORDER BY
    date
""").toPandas()

print(df_DAU)
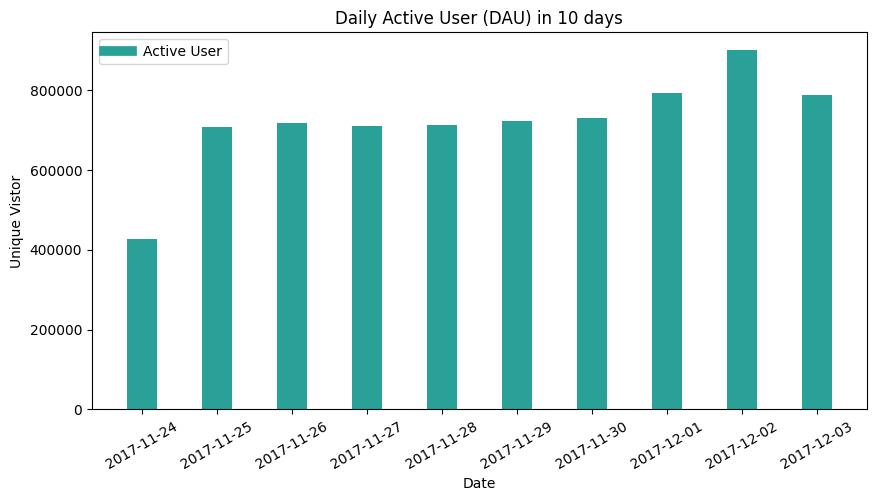
- As to count the unique users in these 10 days, the criteria is any user who conducted one of four behavior count as one active user. Therefore, the relation between DAU to daily active behaviors is similar to the relationship between global unique user numbers and global behavior numbers.
- The trend is similar to DAU histogram, as the time leg and Unix Time function rule still work poorly on a dataset collected from another time zone. The part of unique users is supposed to be grouped on the day after.
Hourly Active Behaviors distribution
df_hour_behavior_count = spark.sql("""
SELECT
    hour,
    SUM(CASE WHEN behavior = 'pv' THEN 0.1 ELSE 0 END) AS pv,
    SUM(CASE WHEN behavior = 'fav' THEN 0.1 ELSE 0 END) AS fav,
    SUM(CASE WHEN behavior = 'cart' THEN 0.1 ELSE 0 END) AS cart,
    SUM(CASE WHEN behavior = 'buy' THEN 0.1 ELSE 0 END) AS buy
FROM
    taobao
WHERE date < '2017-12-04' AND date > '2017-11-23'
GROUP BY
    hour
ORDER BY
    hour
""").toPandas()
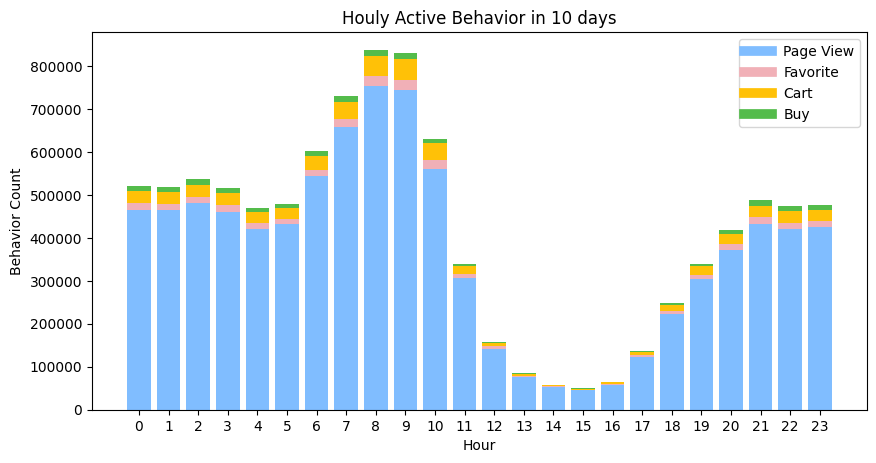
- The distribution is binned by the hour attribute from the table, as it is calculated by averaging the behavior count across 10 days, it compensates for the difference between days.
- The hour illustrates the parsed UNIX time in the American time zone, so there is 13 hours time lag for the real hour within a day scenario. e.g. The 7:00 in US eastern time indicates the 20:00 in the Beijing time zone.
- Based on 2, the peak found between 6:00 to 10:00, when the most popular product using time, is 7 pm to 11 pm in China. It makes sense since this is the time when people get off work and spend time online shopping.
- The behavior count in peak say 9 pm (8:00) is 800k round own, whereas at 4 am (15:00) in the morning, the count is almost only 50k. There are 16 times between the peak and bottom. In day times, the average behavior count is around 500k.
- The rate of decline from peak to bottom is great. It is a common bedtime and people go to sleep quickly. However, once wake up, the usage recovers a bit slower hence users have different things to do.
Hourly Active Users distribution
df_AverageHAU = spark.sql("""
SELECT
    hour,
    ROUND(COUNT(DISTINCT user_id)/10, 0) AS Average_HAU
FROM
    taobao
WHERE date < '2017-12-04' AND date > '2017-11-23'
GROUP BY
    hour
ORDER BY hour
""").toPandas()
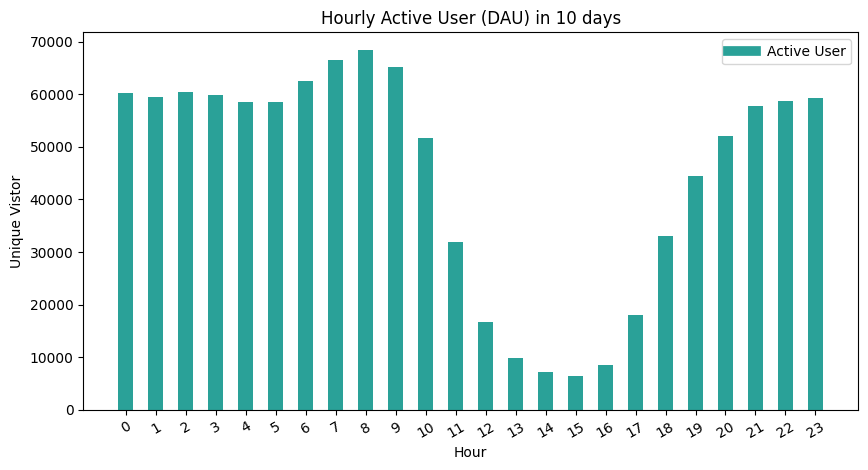
- The trend is similar to hourly behavior count. However, the peak is not as significant as the last one. This indicates that the contribution for unique users on behaviors is not balanced. Given that the trend is similar (same shape), therefore the aspect for causing the balancing issue is that users who are active in the daytime conduct more behaviors at night. It intuitively may make sense that people work in the daytime and get hard to shop online, but at night, they have more time and convenience to use the APP.
- The max value of peak is around 70k whereas the value for the bottom is around 5k, the 12 times difference is greater than 13 times for the behavior count. This indicates the at least for two periods of time (7 pm to 10 pm and 12 am to 5 am), users’ behaviors are normally equalized which helps understand combined with the first point that the users in the daytime are less efficient (number of behaviors per user) than at night.
2. Retention
Retention Rate
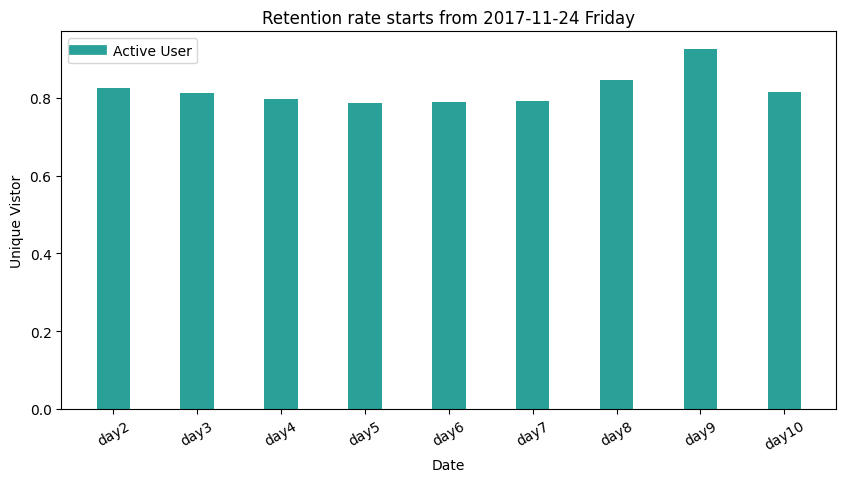
Retention rate formula: The # of active users continuing to subscribe divided by the total active users at the start of a period = retention rate. [-[Source])(https://www.profitwell.com/customer-retention/calculate-retention-rate)]
The concept to have retention rate metric in a marketing atmosphere is to monitor firm performance in attracting and retaining customers. [-Wikipedia] It is similar to churn rate.
This part of Taobao user behavior analysis technically only provides practice on calculating retention rate metric, since there are no attributes identifying the new users, therefore the users who are count as the first-day user may of the old user, which should not be considered.
df_retention = spark.sql("""
    SELECT
        SUM(CASE WHEN day1 > 0 then 1 else 0 end) AS day1,
        SUM(CASE WHEN day1 > 0 AND day2 > 0 then 1 else 0 end) AS day2retention,
        SUM(CASE WHEN day1 > 0 AND day3 > 0 then 1 else 0 end) AS day3retention,
        SUM(CASE WHEN day1 > 0 AND day4 > 0 then 1 else 0 end) AS day4retention,
        SUM(CASE WHEN day1 > 0 AND day5 > 0 then 1 else 0 end) AS day5retention,
        SUM(CASE WHEN day1 > 0 AND day6 > 0 then 1 else 0 end) AS day6retention,
        SUM(CASE WHEN day1 > 0 AND day7 > 0 then 1 else 0 end) AS day7retention,
        SUM(CASE WHEN day1 > 0 AND day8 > 0 then 1 else 0 end) AS day8retention,
        SUM(CASE WHEN day1 > 0 AND day9 > 0 then 1 else 0 end) AS day9retention,
        SUM(CASE WHEN day1 > 0 AND day10 > 0 then 1 else 0 end) AS day10retention
    FROM
        (SELECT
            user_id,
            SUM(CASE WHEN date = '2017-11-24' then 1 else 0 end) as day1,
            SUM(CASE WHEN date = '2017-11-25' then 1 else 0 end) as day2,
            SUM(CASE WHEN date = '2017-11-26' then 1 else 0 end) as day3,
            SUM(CASE WHEN date = '2017-11-27' then 1 else 0 end) as day4,
            SUM(CASE WHEN date = '2017-11-28' then 1 else 0 end) as day5,
            SUM(CASE WHEN date = '2017-11-29' then 1 else 0 end) as day6,
            SUM(CASE WHEN date = '2017-11-30' then 1 else 0 end) as day7,
            SUM(CASE WHEN date = '2017-12-01' then 1 else 0 end) as day8,
            SUM(CASE WHEN date = '2017-12-02' then 1 else 0 end) as day9,
            SUM(CASE WHEN date = '2017-12-03' then 1 else 0 end) as day10
        FROM taobao
        GROUP BY
            user_id)
    """).toPandas()
Repurchase Rate
Repurchase rate is the percentage rate of a cohort having placed another order within a certain period of time, typically calculated within 30/60/90/180/360 days from the first order. [-Source]
Due to the limit of time periods, we calculate the 10-day repurchase rate. The way to calculate it is to find the number of unique users who have purchased twice within 10 days.
n_repurchase = spark.sql("""
SELECT COUNT(DISTINCT user_id)
FROM
    (SELECT user_id, COUNT(behavior) AS buy_times
    FROM taobao
    WHERE behavior = 'buy'
    GROUP BY
        user_id)
WHERE buy_times > 1
""").collect()[0][0]

n_purchase = spark.sql("""
SELECT COUNT(DISTINCT user_id)
FROM
    (SELECT user_id, COUNT(behavior) AS buy_times
    FROM taobao
    behavior = 'buy'
    GROUP BY
        user_id)
""").collect()[0][0]

print(n_repurchase/n_purchase)
The repurchase rate is 66%.
There is another way to calculate which is by finding the count of unique users number who has conducted another transaction within the 10 days except for the first day.
Copyright @ 2021 Zizhun Guo. All Rights Reserved.
