Alibaba Taobao User Behaviors Analysis II: AARRR Framework (Acquisition) - PV, UV, CVR, Funnel Plot
Author: Zizhun Guo
作者:
写于:
1. Recap of the user behavior table
+-------+-------+-----------+--------+----------+-------------------+----------+-----+---+----+---------+
|user_id|item_id|category_id|behavior|timestamps|           datetime|      date|month|day|hour|dayofweek|
+-------+-------+-----------+--------+----------+-------------------+----------+-----+---+----+---------+
|      1|2268318|    2520377|      pv|1511544070|2017-11-24 12:21:10|2017-11-24|   11| 24|  12|        6|
|      1|2333346|    2520771|      pv|1511561733|2017-11-24 17:15:33|2017-11-24|   11| 24|  17|        6|
|      1|2576651|     149192|      pv|1511572885|2017-11-24 20:21:25|2017-11-24|   11| 24|  20|        6|
|      1|3830808|    4181361|      pv|1511593493|2017-11-25 02:04:53|2017-11-25|   11| 25|   2|        7|
|      1|4365585|    2520377|      pv|1511596146|2017-11-25 02:49:06|2017-11-25|   11| 25|   2|        7|
|      1|4606018|    2735466|      pv|1511616481|2017-11-25 08:28:01|2017-11-25|   11| 25|   8|        7|
|      1| 230380|     411153|      pv|1511644942|2017-11-25 16:22:22|2017-11-25|   11| 25|  16|        7|
|      1|3827899|    2920476|      pv|1511713473|2017-11-26 11:24:33|2017-11-26|   11| 26|  11|        1|
|      1|3745169|    2891509|      pv|1511725471|2017-11-26 14:44:31|2017-11-26|   11| 26|  14|        1|
|      1|1531036|    2920476|      pv|1511733732|2017-11-26 17:02:12|2017-11-26|   11| 26|  17|        1|
+-------+-------+-----------+--------+----------+-------------------+----------+-----+---+----+---------+
only showing top 10 rows
| Behavior | Explanation |
|---|---|
| pv | Page view of an item’s detail page, equivalent to an item click |
| fav | Purchase an item |
| cart | Add an item to shopping cart |
| buy | Favor an item |
2. Acquisition
The point for Acquisition analysis is to develop knowledge about the ability of the product to convert visitors into customers. It helps evaluate the efficiency of the business process. The product may have diverse marketing sources of visitors and different channels to fulfill the conversion.
In Taobao user behavior dataset, the ‘behavior’ field can be intuitively interpreted owning the values in an ordinal nature, since the business allows provide purchasing behaviors which are able to independently conducted, e.g. users can choose to purchase the item directly or put it into the cart or favorites. Therefore, there are multiple channels that convert the item visit into the final order. Hence, I take multiple funnel analyses to study its acquisitional traits.
Global Page View (PV), Unique User (UV), PV/UV
# Pychart can query records using Dataframe SQL functions

from pyspark.sql.functions import count, countDistinct
df1.select(countDistinct(df1.user_id).alias('uv')).show()
+------+
|    uv|
+------+
|987991|
+------+
The dataset has 987,991 unique users. Hence, UV = 987,991.
# The same, group by on 'behavior' and find the count for the 'pv'

df1.groupby('behavior').count().orderBy('count', ascending = False).show()
+--------+--------+
|behavior|   count|
+--------+--------+
|      pv|89697359|
|    cart| 5530446|
|     fav| 2888258|
|     buy| 2015839|
+--------+--------+
The dataset has 89,697,359 page view behaviors between 2017-11-24 to 2017-12-03. Hence, PV = 89,697,359.
The PV/UV, the average page view per user evaluates the popularity for the items to be seen in a global sense. We could calculate it for each item. However, this metric needs to be used with other global metrics.
The PV/UV is 90. In these 10 days, the average page views for each unique user is 90.
Bounce Rate
Bounce rate is single-page sessions divided by all sessions, or the percentage of all sessions on the site in which users viewed only a single page and triggered only a single request to the Analytics server. - reference
In the Taobao user behavior case, the unique users who visit items once during the 10-day session would be only considered. Therefore, this bounce rate evaluates the attractiveness of the website instead of a specific item.
Create
# Create TempView with the user count for the different behavior.
# PK: user_id
spark.sql("""
SELECT
    user_id,
    SUM(case when behavior='pv' then 1 else 0 end) as PageView,
    SUM(case when behavior='fav' then 1 else 0 end) as Favorite,
    SUM(case when behavior='cart' then 1 else 0 end) as Cart,
    SUM(case when behavior='buy' then 1 else 0 end) as Buy
FROM
    taobao
GROUP BY
    user_id
""").createTempView("behaviorCount")

spark.sql("""
SELECT
    COUNT(user_id)
FROM
    behaviorCount
WHERE PageView = 1 AND Favorite = 0 AND Cart = 0 AND Buy = 0;
""").show()
+-----------------------+
|count(DISTINCT user_id)|
+-----------------------+
|                     53|
+-----------------------+
The number of unique users who have only 1 page view count is 53. The bounce rate, 53/UV is 0.0053%. It is very small, it proves the visitors, no matter new or old, would not stop discovering the website at the first sight.
Conversion Rate (CVR)
The conversion rate is the percentage of visitors to the website that complete a desired goal (a conversion) out of the total number of visitors.-[Source]
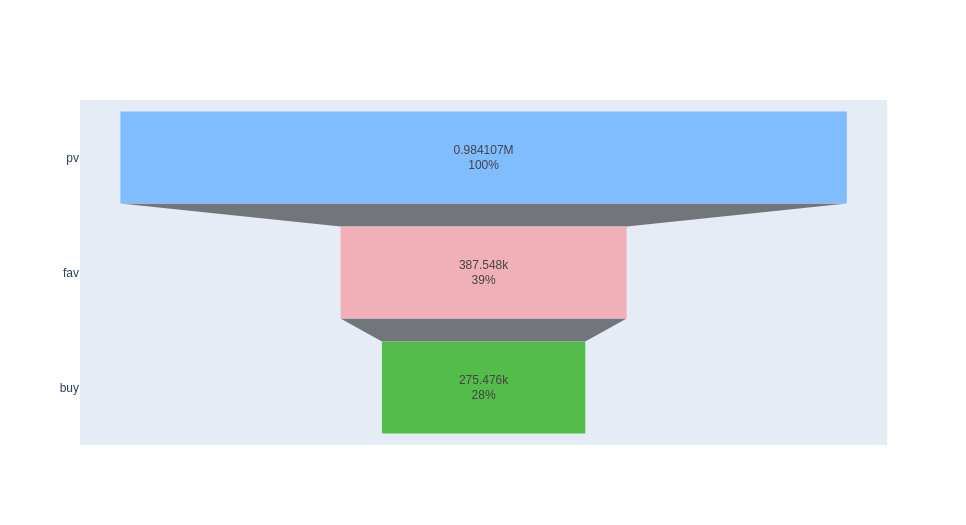
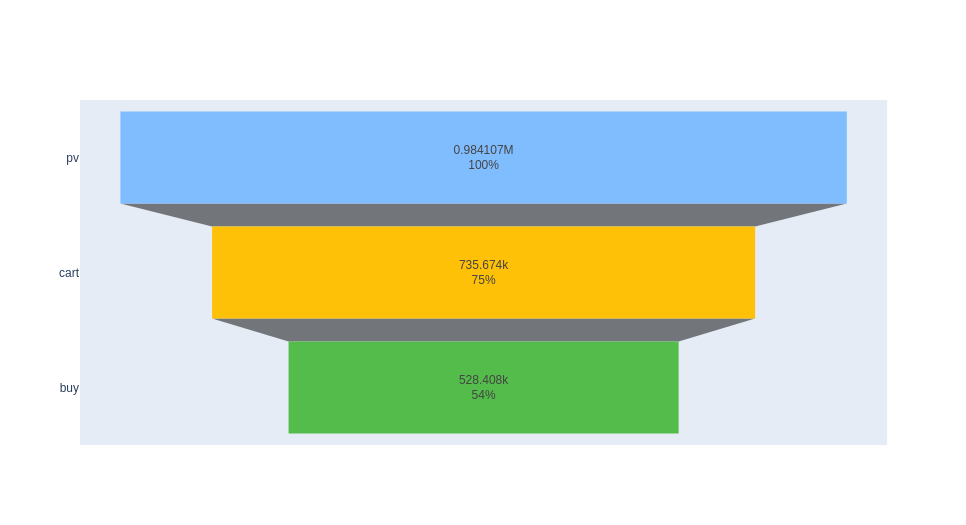
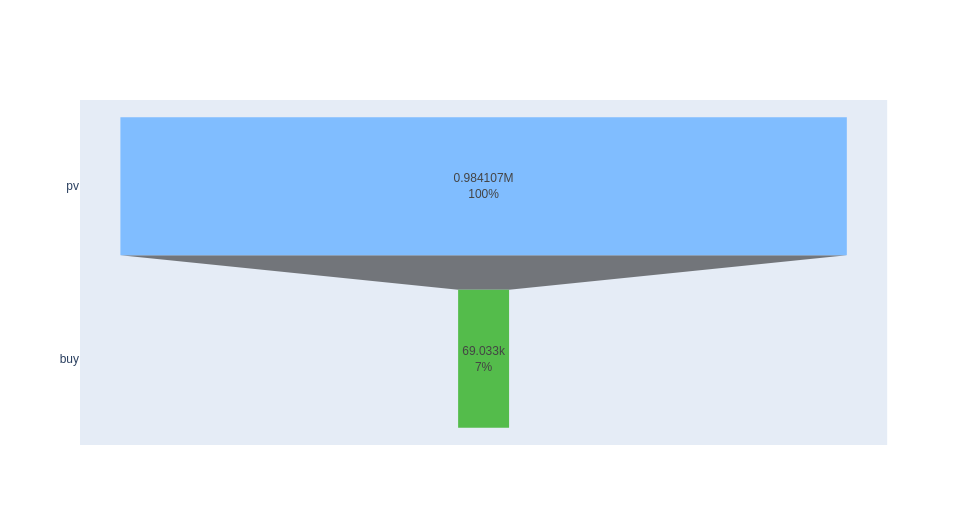
The desired goal is make-purchase. There are three channels to make such conversion (see fig 1 below): 1. page view - favorite - buy; 2. page view - cart - buy; 3. page view - buy. Each channel can conduct a funnel analysis.
pv - fav - buy
CVR for page view user to favorite user = # of users who have pv and fav/ # of users who have pv
n_unique_fav_users = spark.sql("""
SELECT COUNT(DISTINCT user_id)
FROM behaviorCount
WHERE PageView > 0 AND Favorite > 0
""").collect()[0][0] # 387548

n_unique_pv_users = spark.sql("""
SELECT COUNT(DISTINCT user_id)
FROM behaviorCount
WHERE PageView > 0
""").collect()[0][0] # 984107

CVR_pv2fav = n_unique_fav_users/n_unique_pv_users # 387548/984107
The conversion rate for pv to fav is 39.38%.
CVR for page view user to favorite to buy user = # of users who have pv, fav and buy / # of users who have pv
n_unique_fav_buy_users = spark.sql("""
SELECT COUNT(DISTINCT user_id)
FROM behaviorCount
WHERE PageView > 0 AND Favorite > 0 AND Buy > 0
""").collect()[0][0] # 275476

CVR_pv2fav2buy = n_unique_fav_buy_users / n_unique_pv_users # 275476 / 984107
print(CVR_pv2fav2buy)
The conversion rate for pv-fav-buy is 27.99%.
pv - cart - buy
CVR for page view user to cart user = # of users who have pv and cart / # of users who have pv
n_unique_cart_users = spark.sql("""
SELECT COUNT(DISTINCT user_id)
FROM behaviorCount
WHERE PageView > 0 AND Cart > 0
""").collect()[0][0] # 735674

CVR_pv2cart = n_unique_cart_users / n_unique_pv_users # 735674 / 984107
print(CVR_pv2cart)
The conversion rate for pv-cart is 74.56%.
CVR for page view user to cart to buy user = # of users who have pv, cart and buy / # of users who have pv
n_unique_cart_buy_users = spark.sql("""
SELECT COUNT(DISTINCT user_id)
FROM behaviorCount
WHERE PageView > 0 AND Cart > 0 AND Buy > 0
""").collect()[0][0] # 528408

CVR_pv2cart2buy = n_unique_cart_buy_users / n_unique_pv_users # 528408 / 984107
print(CVR_pv2cart2buy)
The conversion rate for pv-cart-buy is 53.69%.
pv - buy
CVR for page view user to buy user = # of users who have pv and buy / # of users who have pv
n_unique_pv_buy_users = spark.sql("""
SELECT COUNT(DISTINCT user_id)
FROM behaviorCount
WHERE PageView > 0 AND Favorite = 0 AND Cart = 0 AND Buy > 0
""").collect()[0][0]

CVR_pv2buy = n_unique_pv_buy_users / n_unique_pv_users
print(CVR_pv2buy)
The conversion rate for pv-buy is 7.01%. (There might have users who have both pv-buy or pv-fav/cart-buy behaviors, such SQL would exclude those users who have both behaviors, therefore the CVR for pv-buy would be higher if based on items)
Funnel plot for 3 channels based on # of users
from plotly import graph_objects as go

fig1 = go.Figure(go.Funnel(
    y = ['pv', 'fav', 'buy'],
    x = [n_unique_pv_users, n_unique_fav_users, n_unique_fav_buy_users],
    textposition = "inside",
    textinfo = "value+percent initial",
    marker = {"color": ["#80bdff", "#f1b0b7", "#54bc4b"]})
    )
fig1.show()
Copyright @ 2021 Zizhun Guo. All Rights Reserved.


