Yolo机制第二部分 YOLO Mechanism Part II: Training, Evaluation Metrics
Author: Zizhun Guo
作者:
写于:
Training
Use Pretrained Model
The pre-trained model is a deep learning architecture that has been trained to perform specific tasks on large amounts of data (for example, identifying classification problems in pictures). This kind of training is not easy to perform, and usually requires a lot of resources, beyond the resources available to many people who can use deep learning models, such as not having a large number of such GPUs. It should be noted that the weight of the pre-training model needs to conform to the model structure used in the current task. In other words, the pre-training model must also be trained with the model structure of the current architecture. Therefore, the only difference is whether the machine equipment can support large-scale dataset training.
The purpose of this is to increase training efficiency. In fact, many pre-training models already have relatively good prediction efficiency, but it should be noted that the data set during training of the pre-training model should have a target value similar to the current prediction task. In our case, there are two target categories in the Coco dataset that are similar to the two categories of the currently used Open Image dataset, namely Street Sign (COCO) corresponding to Traffic sign (Open Image) and Stop sign (COCO) and Stop sign ( Open Image).
Training Work Flow
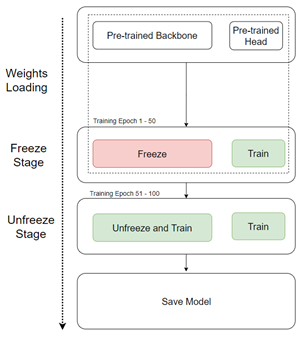
We train in two steps:
-
Warm-up stage: Load the weights of the pre-trained model. For the first 50 epochs, the first 60 layers of pre-trained model hidden layers are frozen. These 60 layers of hidden layers are the backbone feature extraction network. The purpose of this is to speed up the training speed, because only the weights of the YOLO head part are updated, which protects the network weights from being influenced at the initial stage of training.
-
Unfreeze stage: Unfreeze the front 60 layers of backbone feature extraction network starting from the 51st epoch, and let the entire neural network participate in training. The training time will be greatly increased, but all weights will be updated in which the purpose is to make the backbone network fully adapt to the dataset of the current task.
Evaluation Metrics
Generally speaking, for neural network models, it is hoped that the network model has a fast recognition speed, a small memory usage, and high detection accuracy. In terms of the current target detection problem, the general commonly used evaluation indicators are: mean average precision (map) and floating point operations per second (FLOPS). For the reason that our task only detects objects in the format of image files instead of video streaming, it is no longer needed to evaluate the detecting speed of the YOLO detector in our case, therefore mAP is the only metric we use to evaluate the performance.
Precision and Recall
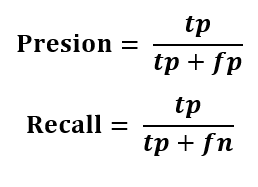
Below follows the definition of precison and recall :
tp represents true positive, fp represents false positive, fn represents false negative. The precision measures of all predictions made the percentage of correct positive predictions. The recall measures of all positive cases in reality the percentage of the correct positives cases are predicted. The trade-off between the two metrics depends on the task goal. In our case, the YOLO object detector is designed for traffic signs and stop signs detection which is related to traffic scenarios that are safety-sensitive, therefore to detects as many positive cases as possible from all positive cases is more important to increase the detection percentage among its own prediction, hence recall should be more primary to consider than precision. However, we only use precision and recall to calculate AP by drawing the PR-Curve.
Average Precision (AP) and PR-Curve
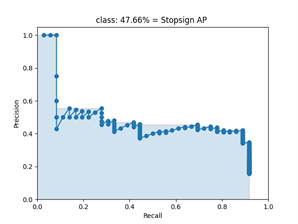
The definition of AP is defined as the area under the precision-recall curver (PR-curve). For multiple pairs of precision and recalls values, we get them through changing the confidence score threshold. The object that has a lower score than the threshold would be detected as a false positive.
Given a PR-curve example shows above, the precision goes down once the recall goes up and vice versa. As a simple explanation to this pattern is, as more cases being detected positive cases, the precision increases due to at the same time, the overall detection cases increase as well but in smaller percentages. This would cause the recall to become smaller. Hence, the curve looks monotonically decreasing.
Noted that the later number simply represents the IoU threshold values. For example, AP50 represents the IoU threshold that equals 50%.
Mean Average Precision (mAP)
The metric mAP the averaged AP across all categories. In our cases, we have two categories Traffic sign and Stop signs, therefore the mAP in our experiment it simply means the summation of Traffic sign mAP and Stop sign mAP that divided by 2. The mAP is calculated after running the NMS algorithm. The mAP is the final evaluation metric of the detection model. After operations are completed, the final detection result is used to calculate the mAP value.
Copyright @ 2021 Zizhun Guo. All Rights Reserved.


