大数据分析课程:Otus方法 Data Mining: Otsu's Method (Object + Regularization)
Author: Zizhun Guo
作者:
写于:
- Homework 2: Otsu Method for clustering 1D data into two groups, using bining method to quantize data and finding the best splitting point.
- Binning method for quantizing data:
- Otsu Method python code:
- Homework 1: Metaprograme CSV file read
- Mentor Program (what is like)
- Trained Program (what is like):
This repository collects all homework and projects of 2020 Spring RIT Computer Science Master’s level course - CSCI-720-Big-Data Analytics.
Projects and Course ongoing Keep updating!
Homework 2: Otsu Method for clustering 1D data into two groups, using bining method to quantize data and finding the best splitting point.
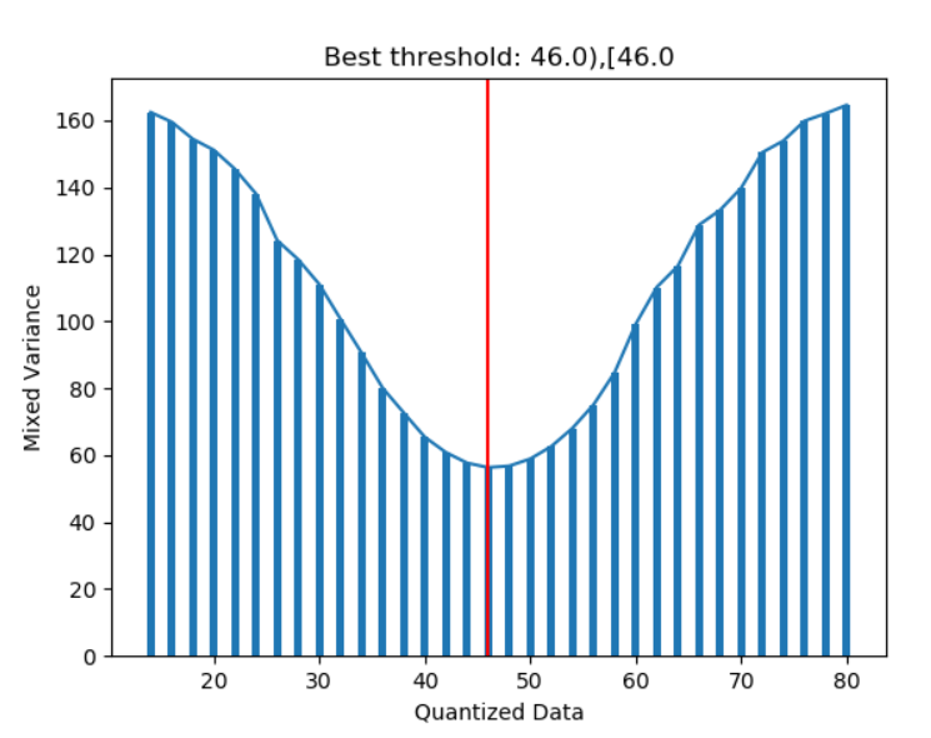
- This program graph the mixed variance from two groups based on different best splitting points.
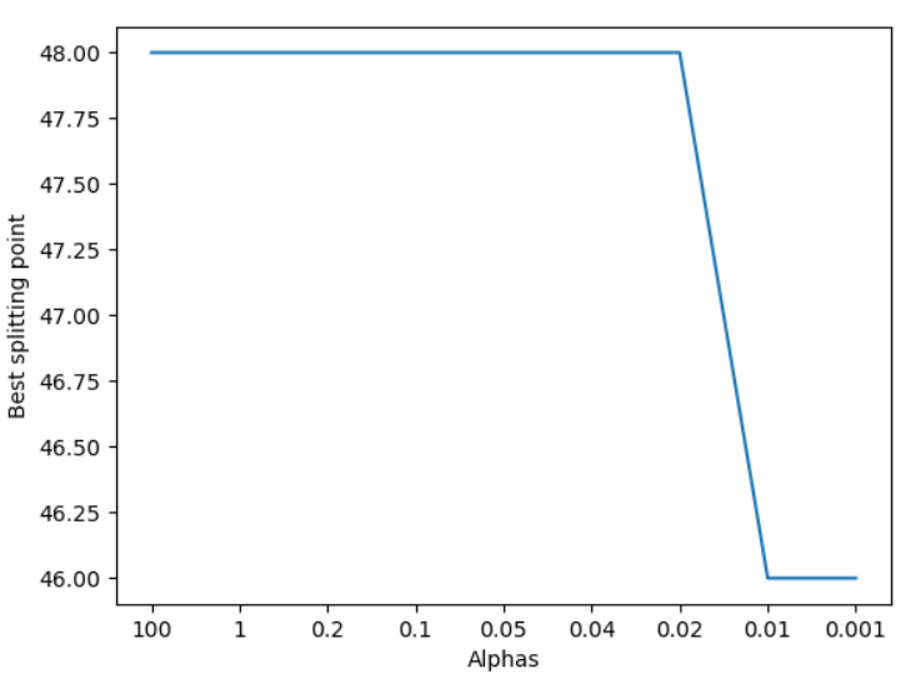
- For second cases, it used Regularization to help break ties if costs for each splitting point are close.
- The program also compared the change of splitting point (bins) with different values of Alpha (a arg of Regularization).
The point of Otus Method is to find the best splitting point by selecting one with minimal cost. Cost = Objective + Regularization
Binning method for quantizing data:
data_ages= np.floor(df_snowfolks_data_raw['Age'] / 2) * 2
Otsu Method python code:
    best_cost = np.inf                      # best cost
    best_threshold = start                  # best splitting point

    while start <= end:
        wt_left = np.sum(data[data < start])/np.sum(data)     # fraction left
        wt_right = np.sum(data[data >= start])/np.sum(data)   # fration right
        wt_var_left = np.var(data[data < start])              # variance left
        wt_var_right = np.var(data[data >= start])            # variance right

        mixed_variance = wt_left * wt_var_left \
                        + wt_right * wt_var_right             # mixed variance

        if is_regularization:
            mix_cost = mixed_variance \
                    + abs(np.sum(data[data < start]) \
                            - np.sum(data[data >= start])) \
                        / 100 * alpha         # assign mixed cost to otsu' cost
        else:
            mix_cost = mixed_variance         # assign mixed variance to otsu' cost

        if (mix_cost <= best_cost):           # assign the minimal mixed cost as otsu' cost
            best_cost = mix_cost
            best_threshold = start

        start += offset                       # splitting point moves on


As results showed, it is easy to see at this point, the cost is the lowest. But, in industrial project, with the size of data being extremely huge. The differences between objects could be tiny which may cause the splitting points swinging in a wide interval. So in order to break tie, the Regularization should be carefully made up for better performance.
Homework 1: Metaprograme CSV file read
This home is about writing a Mentor program that runs it to produce a Trained program which can read a CSV file in current directory and output its number of rows and columns. The empty rows and columns shall be ignored. The programs were written in Python, with IDE of VScode and Anaconda Jupyton Notebook for visual testing. The packages used are Pandas, Numpys.
“No repeatable work” - That is what I learned from this task. Told by my professor, this thought is extremely useful for industrial works. When there are big size data set to train, mentor program can be put in the clouds so that let server train the program, once it returns the trained model, it can be directly use for doing prediction with parameters well set.
Mentor Program (what is like)
# Writes in CSV file name to trained program
    if "fileToRead" in trainedinfo.keys():
        str +=  f"\n\tdf = pd.read_csv(\"{trainedinfo['fileToRead']}\")"
        str += f"\n\trow_count = df.shape[0]+ 1 # must exist headers if a row is read as the headers"
        str += f"\n\tcolumn_count = df.shape[1] # default count the size of columns"
        str += f"\n\tfor row_index in range(0, df.shape[0]):"
        str += f"\n\t\tcolumn_index = 0"
        str += f"\n\t\tfor j in range(0, df.shape[1]):"
        str += f"\n\t\t\tif pd.isna(df.iloc[row_index, column_index]):"
        str += f"\n\t\t\t\tcolumn_index += 1"
        str += f"\n\t\tif column_index == df.shape[1]: # if all elements are NaN"
        str += f"\n\t\t\trow_count -= 1"
        str += f"\n\tfor column in df.columns:"
        str += f"\n\t\tif(df[column].dropna().empty):"
        str += f"\n\t\t\tcolumn_count -= 1"
        str += f"\n\tprint(\"rows:       \" + str(row_count))           # number of rows"
        str += f"\n\tprint(\"columns:    \" + str(column_count))       # number of columns including headers"
Trained Program (what is like):
    df = pd.read_csv("A_DATA_FILE.csv")        # read dataframe from the given CSV file
    print("rows:       " + str(df.shape[1]))           # number of rows
    print("columns:    " + str(df.shape[0] + 1))       # number of columns including headers

    row_count = df4.shape[0]+ 1
    column_count = df4.shape[1]

    for row_index in range(0, df4.shape[0]):
        column_index = 0
        for j in range(0, df4.shape[1]):
            if pd.isna(df4.iloc[row_index, column_index]):
                count += 1
        if count == df4.shape[1]: # if all elements are NaN
            row_count -= 1        #

    for column in df4.columns:
        if(df4[column].dropna().empty):
            column_count -= 1

    print("rows:       " + str(df.shape[1]))           # number of rows
    print("columns:    " + str(df.shape[0] + 1))       # number of columns including headers
All rights reserved. The shared programs provided in this repo are only meant for referencing and demonstration. Do not copy and share to other usage as homework for other courses, which would cause academic dishonesty. Please be advised.